Common errors hiding in spreadsheet-built carbon inventories

Updated:
April 2026

What do the experts think...

For years, measuring a carbon footprint was something most Australian businesses did because they wanted to, for customers, for investors, for tenders, or simply because it aligned with their values. The work often happened quietly, in an annual sprint with an external consultant, and the output was a sustainability report and a spreadsheet filed somewhere on SharePoint.

That world is gone.

Under the Australian Sustainability Reporting Standards (ASRS), entities now have to disclose climate-related financial information, including Scope 1, 2 and material Scope 3 emissions, as part of their annual report. It's board-signed. It's assured. And the numbers need to hold up to the same level of scrutiny as anything else sitting inside a financial statement.

Over the past year, we've been reviewing a steady stream of carbon inventories that ASRS reporters have had built by external consultants, typically over several years of voluntary reporting. We usually come in on the end-to-end ASRS requirements, helping companies with their metrics and targets, and translate their existing footprint work into disclosure-ready outputs.

What we keep finding is worrying us.

The errors we didn't expect to see

We expected edge cases. We expected methodology debates. What we didn't expect was how often the underlying numbers themselves and the basic application of the Greenhouse Gas Protocol are simply wrong.

Here are some examples of simple, but significant errors we found:

Measurement and scope errors

  • Working-from-home emissions had been miscalculated in their baseline. The error rolled quietly forward year after year, because the formula was copied rather than reviewed.
  • Inflation factors were applied in the wrong direction against spend-based emissions factors, causing a material overstating of their footprint.
  • A footprint built on hard-coded values with no source data or supporting evidence sitting behind them. In one case, the percentage attribution for an office was fixed inside a formula; when occupancy changed, the calculation didn't, and Scope 2 emissions were quietly understated. Fine for an internal PDF. A serious problem when an assurance provider asks for proof.

Spreadsheet structure and formula errors

  • Direct cell links wired across tabs in place of structured lookups. When a source value changed shape or type, the error flowed straight through to the totals with nothing to flag it.
  • Hundreds of manual entries underpinning a single inventory. Every one of them is an opportunity for a typo or a missed update, and a workload no reporting team should be wearing in 2026.
  • Multiple inventories for the same client presented in a different format every year, making year-on-year comparison difficult for the company, and almost impossible for anyone trying to read across a sector.

Data quality and review gaps

  • A single decimal point in the wrong place on a material line item. It slipped through because no one had applied an analytical lens to sense-check the totals, and the entire calculation was off as a result.
  • No summary view across the underlying tabs, which left the client doing their own totalling on top of the consultant's model just to have numbers ready for reporting. Another manual step, another place an error can enter.

None of these came from bad intent. They came from the way the work is done: bespoke spreadsheet models, often rebuilt each year, managed by a small number of people.

Got a question? 
Interested to learn more?

Trace can help you at each stage, at your pace, aligned to your goals.

Reach out to talk to one of our friendly team now

Why spreadsheets struggle under ASRS

Spreadsheets are extraordinary tools. They're also where a surprising share of material errors tend to appear, and carbon accounting puts them under particular strain.

Emissions factors update regularly. Methodology guidance evolves. Activity data flows in from many sources with a variety of units: utility bills, fleet logs, expense categories, supplier statements, and needs to be mapped consistently year after year. A spreadsheet model built in 2022 is rarely the same spreadsheet model in 2026, even if the file name hasn't changed. Every manual edit is a place an error can enter, and very few of those edits leave a trail an auditor can follow.

Under the previous voluntary regime, that fragility was an annoyance. Under ASRS, it's a material risk.

The hidden cost of inventory errors

When we talk to finance and sustainability leaders about the alternative to a spreadsheet approach, the conversation often starts with price. That's a fair place to begin: platform-based measurement is generally more cost-effective than a bespoke annual engagement. But price alone undersells what's actually at stake.

If a material error is identified, you don't just change a figure. You may need to:

  • Restate your prior year baseline
  • Redo the affected portions of your metrics and targets disclosures
  • Explain the change in your next annual report or even re-publish the previous year
  • Rebuild your transition plan modelling on the corrected figures
  • Answer questions from your board, your auditors and potentially your investors about how the error happened in the first place
  • Receive a modified audit opinion

Once you add up the internal hours, the rework, the reputational impact and the drag on the rest of your disclosure program, a "cheap" inventory can become the most expensive line item in your reporting stack.

What good looks like

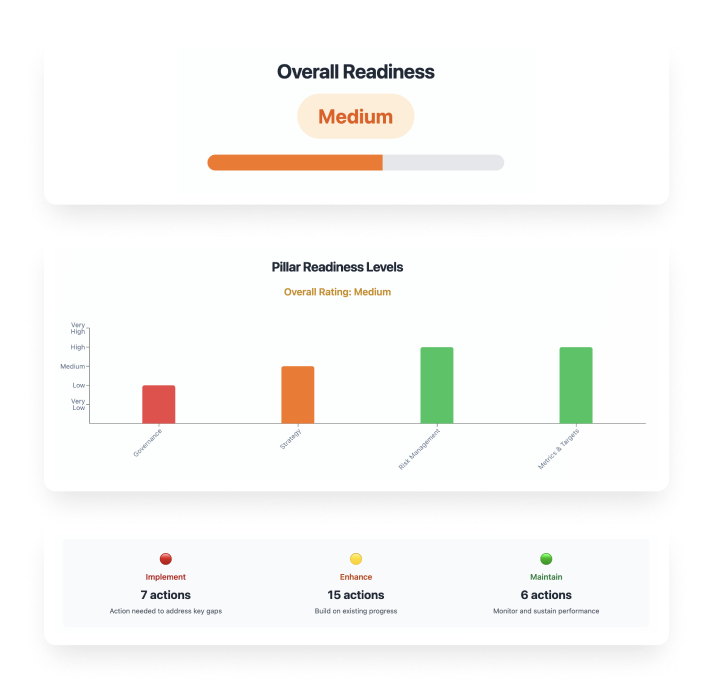
The inventories that hold up best under scrutiny share a handful of characteristics. They are:

  • Built on a consistent methodology that remains comparable between clients and between years
  • Connected to source data, so every number in the final report can be traced back to an original bill, log, invoice or system record
  • Supported by a controlled library of emissions factors that updates centrally when the underlying factor changes, rather than relying on a human remembering to
  • Reviewed with analytical checks, movement analysis, ratio checks, variance explanations, that any finance team would recognise

This is the standard we've built Trace against. Not because spreadsheets and consultants can't reach it in theory, but because holding that standard consistently, across every customer, every year, at audit-grade quality is what software, a controlled methodology and an expert team are genuinely good at, and it's exactly where bespoke, spreadsheet-based engagements tend to drift.

Stress-test your footprint before your assurance provider does

If your organisation is a Group 1, 2 or 3 ASRS reporter, the single most useful thing you can do this year is have someone independent look at the numbers before your assurance provider does. Better yet, well before your disclosure deadline.

If the numbers hold up, you've gained confidence heading into your first disclosure. If they don't, you've given yourself time to fix it on your terms, not in a footnote to next year's annual report.

We'd much rather help a business avoid that conversation than walk them through it. Book a call with the Trace team to have your current carbon inventory reviewed ahead of your first ASRS disclosure.

Trace is a climate reporting platform specialising in ISSB and AASB standards, helping businesses navigate mandatory climate disclosure with clarity and confidence.

Free ASRS resources to help you upskill & prepare

Just learning about ASRS

The ASRS Strategy On A Page

Start here if you're new to ASRS. Get a complete overview of what's required, key deadlines, and your step-by-step compliance roadmap in one visual guide.
Download now
See what others are doing?

The ASRS Pulse Report 2025

See how other Australian businesses are preparing. Benchmark your readiness against industry peers and learn from early adopters' experiences and challenges.
Download now
Ready to start implementing

The ASRS Prep pack 2025

Ready to take action? This comprehensive toolkit includes templates, checklists, and practical frameworks to begin your ASRS implementation immediately.
Download now
Asses your current position

AASB readiness assessment (free!)

Know exactly where you stand. Take this 5-minute assessment to identify your compliance gaps and get a personalised action plan for your business.
Download now

✉️ Newsletter: Climate Reporting Simplified.


This monthly edition unpacks what mandatory climate reporting really requires and how to minimise cost, disruption & confusion.

Thank you! Your submission has been received!
Oops! Something went wrong while submitting the form.

Newsletter:  Climate Reporting Simplified.
This monthly edition unpacks what mandatory climate reporting really requires and how to minimise cost, disruption & confusion.

💚 Don’t worry, we won’t spam!

London - Sydney

© Copyright 2025 Trace | All Rights Reserved